Get Started


Analytics Dashboard, built around how you actually work
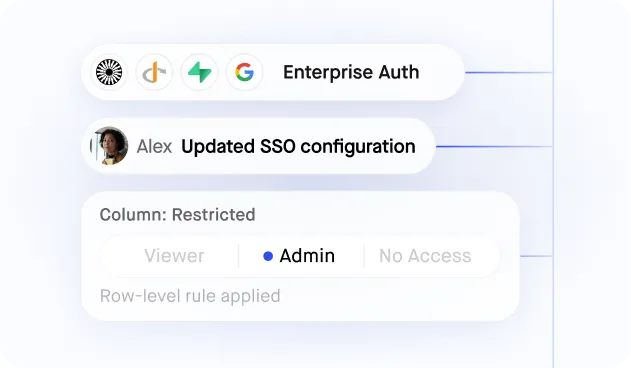
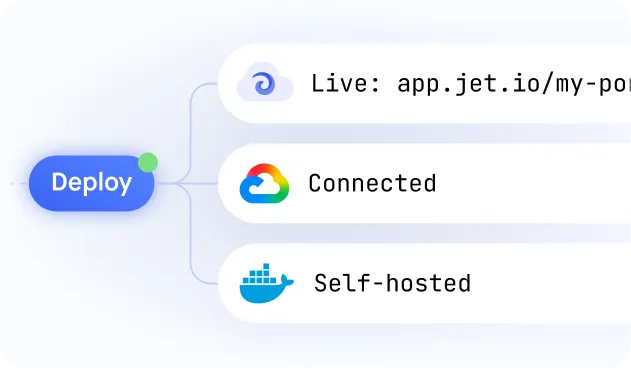
Analytics Dashboard that lets you drill from the chart into the records behind it. Your data stays put. SSO, permissions and audit logs included.
Build secure app fast



Build secure app fast
.jpeg)
Dashboards on Your Live Data — No Warehouse Required
Connect Postgres, MySQL, BigQuery, Snowflake or Google Sheets and build dashboards directly on your source data — no ETL pipeline or copy to maintain.
.jpeg)
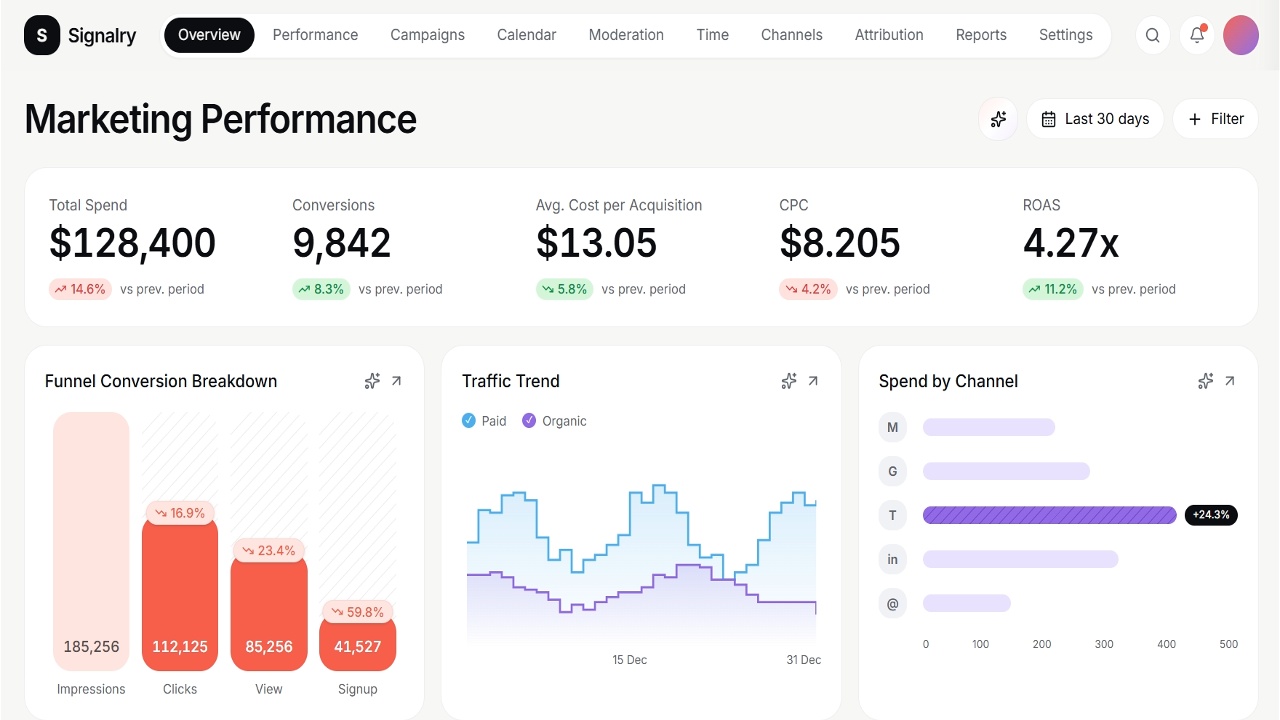
Charts, Tables and Pivots in One View
Combine KPI tiles, time-series charts and drill-down tables on a single canvas so the whole picture lives in one place.
.jpeg)
Role-Based Access to Every Metric
Decide which teams see which dashboards and fields — share revenue with leadership while hiding it from everyone else.
.jpeg)
Filters and Drill-Downs for Self-Service
Give users date ranges, segments and click-through detail so they answer their own questions without pinging analysts.
.jpeg)
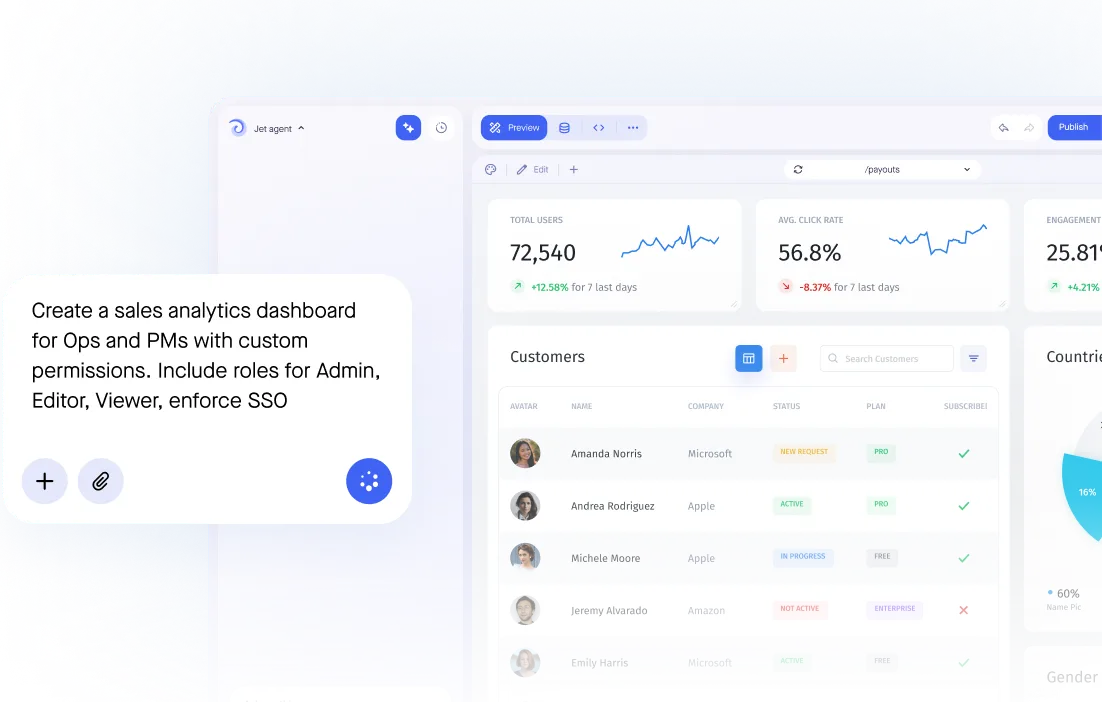
Generated From a Prompt, Refined by You
Describe the dashboard you need and Jet builds it on your schema — then tweak layout, metrics and logic without code.
Similar Use Cases
No items found.

.png)



.png)












.png)




















.svg-min.png)






Frequently asked questions
What is an analytics dashboard?
A dashboard for examining data to answer a question, rather than for monitoring a process. The distinction decides how it should be built.
How is this different from an operational dashboard?
An operational dashboard answers 'what needs attention now' and usually lets you act. An analytics dashboard answers 'what happened and why', so it favours breadth, history and slicing. Most teams need both and get frustrated expecting one to behave like the other.
Can users slice the data themselves?
Yes. Filters and dimensions can be exposed so a question gets answered without a request to the data team, which is normally the bottleneck being solved.
Do we need a data warehouse?
For large-scale historical analysis across many systems, usually yes. For most operational analytics, reading your production databases and APIs directly is sufficient and considerably faster to stand up.
Can we control who sees which data?
Yes, by row and by column, so a dashboard can be shared broadly without exposing the fields that should not travel with it.