Google Sheets Inventory
App
Google Sheets Inventory
Overview
A Google Sheets inventory template usually means a spreadsheet with columns for SKU, quantity and location. That works until two people edit the same row, someone types text into a quantity cell, or a warehouse contractor needs access to one tab but not the others. This template takes a different approach: your Google Sheet stays the place the data lives, and Jet Admin puts a real inventory app on top of it.
You connect the sheet you already use, and the template gives you product lists, stock views, forms for stock movements and a dashboard of low-stock items. Changes made in the app are written back to the sheet, so anyone who still prefers the grid keeps working in it. Nothing is migrated and there is no second copy of the data.
Why put an app on your inventory spreadsheet
Everyone can edit every cell. A shared Google Sheet gives all editors the same access. In the app you decide who can see and change which rows and columns, so a store manager updates their own location and nothing else.
Bad input breaks formulas. Required fields, number types and dropdowns are enforced in the app's forms, so stock counts stay numeric and locations come from a fixed list.
Stock movements are hard to trace. Receiving, transfers and adjustments are logged as records with a user and a timestamp instead of being overwritten in place.
Reorder points get missed. Low-stock views and dashboard tiles show what needs reordering today, and a workflow can post an alert to Slack or email when an item crosses its threshold.
You will outgrow the sheet eventually. When row counts or concurrency become a problem, connect a PostgreSQL or MySQL database and point the same app at it. The interface your team uses does not have to be rebuilt.
Template features
Product catalog
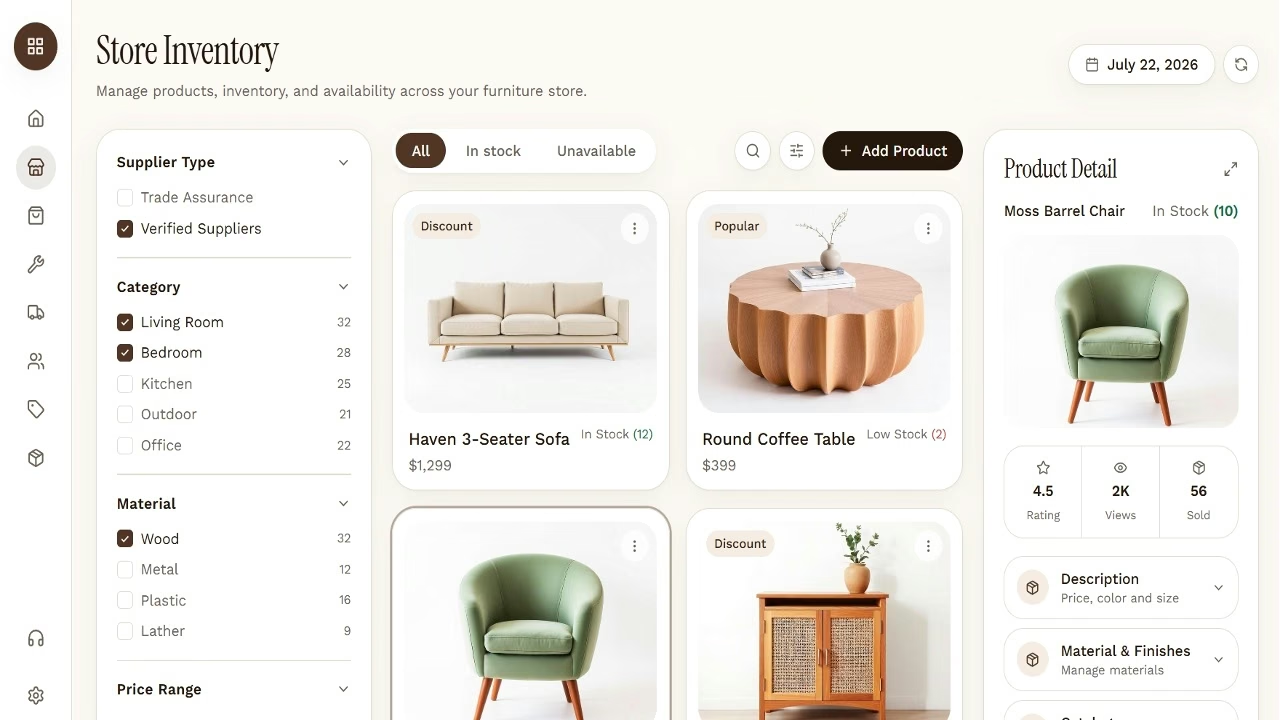
Search, filter and sort every item in your sheet with photo previews, SKU, category, supplier and current stock. Open any product to see its full record and movement history.
Stock levels by location
See quantities per warehouse, store or shelf in one table. Filter to a single location for the people who work there.
Stock movement forms
Record goods received, transfers between locations and adjustments through validated forms that update the sheet instead of asking people to edit numbers by hand.
Low-stock dashboard
KPI tiles and charts built on your sheet data show items below reorder point, stock value and recent movements at a glance.
Reorder alerts
Trigger a workflow when an item drops below its threshold: notify a buyer in Slack, send an email, or create a purchase request record.
Row-level permissions
Give each user or team access to only the locations, categories or columns they need. External suppliers can sign in to a portal without being invited to the spreadsheet.
Who is this template for?
- Small businesses already tracking stock in Google Sheets who want forms, permissions and a dashboard without moving to a new inventory system.
- Operations teams with several locations that need each site to update its own stock without touching anyone else's.
- E-commerce and retail teams who want low-stock alerts and a clear reorder list on top of the sheet they export from other tools.
- Teams planning to move off spreadsheets who want to change the database later without retraining users on a new interface.
How to set up your Google Sheets inventory template
Step 1: Connect your Google Sheet. Sign in with Google and pick the spreadsheet and tabs that hold your products, locations and movements.
Step 2: Map your columns. Match the template's fields (SKU, name, quantity, location, reorder point) to the columns in your sheet. Add any extra columns you track.
Step 3: Set validation rules. Mark required fields, number types and dropdown values so the app rejects input that would break your sheet.
Step 4: Configure permissions. Create roles for buyers, warehouse staff and managers, and restrict rows or columns per role.
Step 5: Add alerts. Turn on the low-stock workflow and choose where notifications go.
Step 6: Publish the app. Share it with your team or with external users. The sheet keeps working as before for anyone who still needs it.
Frequently asked questions
Does my data stay in Google Sheets?
Yes. The sheet remains the source of truth. The app reads from it and writes changes back to it; nothing is copied into a separate database.
Can people still edit the spreadsheet directly?
Yes. The app and the sheet work on the same data, so anyone who prefers the grid can keep using it. Most teams limit direct sheet access once the app is in place, because the app enforces validation and permissions.
Is this template free?
You can start from the template for free and customize it in Jet Admin.
What happens when my inventory outgrows Google Sheets?
Connect a PostgreSQL or MySQL database and point the app's data at it. The screens, forms and permissions stay the same.
Do I need to write code?
No. Setup is done in the visual builder. Formulas, JavaScript and custom components are available if you want them, but they are optional.
Data sources

.svg)




Use Cases
Categories
Features
Similar templates




Connect & sync your data with 30+ data sourse’s


Build frontend Apps 10x faster


Frequently asked questions